

然而,风险(即潜在的不利影响)不仅由自然灾害(如洪水、干旱)引发,还与孕灾环境、承灾体及防灾减灾能力密切相关[18],因此,风险评估要综合考虑危害性、暴露度和脆弱性之间的相互作用[19-21]。这3个关键因素相互联系,共同影响着灾害的发生与演变,体现了复杂且多变的洪水灾害特征[22-23]。多标准决策分析(MCDA)方法已经在洪水风险评估中得到了广泛应用。该方法的关键步骤为确定各因素的权重值,最常使用层次分析法(AHP)[24]。然而它高度依赖于专家的主观经验和知识,在选择每个因素的权重时具有较强的主观性。相较而言,熵权法不依赖于主观经验,而是基于数据的变化和信息量来确定权重,在区域、城市和流域不同尺度均有应用。Malekinezhad等[25]从地理、水文和人类活动3方面选取指标利用熵权法对哈马丹市城市实现洪水灾害分析; Lü等[26]考虑城市的洪水承载情况和抗灾能力2方面利用熵权法评估了郑州市2006—2015年城市防洪风险变化情况。Wu等[27]从危害性和脆弱性选择指标利用熵权法评估了流域洪水风险。
1 数据和方法
1.1 全球洪水数据及趋势分析方法
1.1.1 洪水数据来源
本文的洪水数据来自比利时鲁汶大学灾害流行病学研究中心(CRED)创建并管理的紧急灾难数据库(Emergency Events Database,EM-DAT),网址https://www.emdat.be/。该数据库为国际救援计划、科学研究提供了大量自然和人为灾害的数据支撑[31]。EM-DAT记载了每次洪水事件的位置信息、所属国家、所属大洲、起止时间、死亡人数及影响人数等内容。数据库对于灾害事件收录条件为在死亡人数达到10及以上、受影响人数达到100及以上、宣布进入紧急状态及请求国际援助4种情况中至少存在1种。考虑到数据库早期数据完整性和准确度难以得到保障,本文选取1965—2023年共59 a数据进行研究。
1.1.2 趋势分析方法
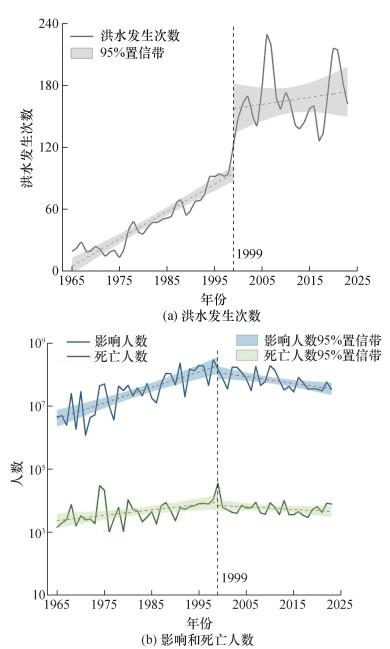
首先,本文采用MK法对全球洪水发生次数、影响人数、死亡人数进行趋势分析[32]。利用参数K表示趋势斜率,K>0为上升趋势,K < 0为下降趋势; R2表示趋势拟合程度,R2接近1,说明数据的趋势模型拟合得越好; P表示显著性水平,P < 0.05表明趋势显著,否则表示趋势不显著。其次,本文对1965—2023年六大洲的洪水事件进行分析。利用百分位法,基于全球洪水影响人数和死亡人数的25%和75%分位数将洪水事件划分为轻灾、中灾和重灾,分析不同大洲的洪水灾害等级及其趋势演变。具体而言,当影响人数和死亡人数对应的等级不一致时,取两者中较高的等级作为该事件的最终灾害等级,以避免低估其灾害影响。最后,本文对这59 a各个国家单位面积上的累计洪水发生次数、影响人数和死亡人数进行空间分析。
1.2 全球洪水风险因素数据来源及分析方法
1.2.1 洪水风险因素数据来源
表 1 洪水风险因素分析数据来源 |
1.2.2 风险计算方法
然后,本文通过分析降水量、地理高程、人口密度和城市化率4个指标与洪水发生次数之间的相关性确定正负指标,对各指标进行Min-Max归一化。对于正相关指标,数值越大意味着洪水风险越高; 而对于负相关指标,数值越大意味着洪水风险越低。因此,正相关和负相关指标分别采用式(1)和(2)进行标准化。
其中:i为第i个指标类型,j为该类指标中的指标个数,xij为标准化前的原始值,xijmin为第i类指标中的最小值,xijmax为第i类指标中的最大值。
2 主要结果
2.1 全球洪水事件演变趋势
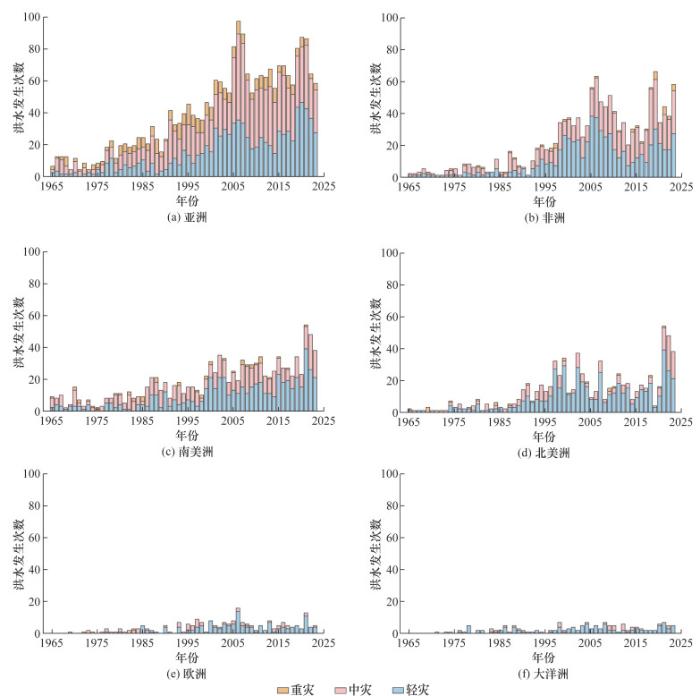
本文基于1965—2023年洪水影响人数和死亡人数的25%和75%分位数划分灾害等级,即轻灾、中灾和重灾,并按事件的较高等级进行分类统计。由图 2可知,亚洲洪水发生最为频繁,总计2 322次,在2006年达到高峰(97次),洪水灾害以中灾为主,占洪水总发生次数比重为48.9%。其次为非洲,洪水发生次数总计1 266,中灾为主,占比49.4%。南美洲洪水发生次数总计1 084,轻灾为主,占比49.1%。欧洲洪水发生次数总计762,轻灾为主,占比64.0%。北美洲和大洋洲洪水发生次数总计分别为219和154,轻灾占比分别为68.0%和76.0%。
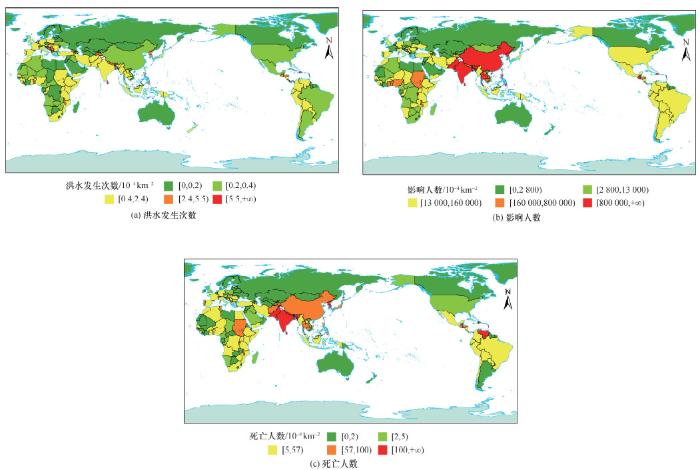
由于各大洲洪水发生情况存在差异性,本文进一步对各国家单位国土面积上的洪水发生次数、影响人数和死亡人数进行分析。根据图 3显示,洪水频发的国家主要分布在南亚、东南亚、非洲东部及南美洲。海地单位面积洪水发生次数最多(23次/104km2),其次为斯里兰卡(14次/104km2)、布隆迪(13次/104km2)和卢旺达(12次/104km2)。按照国家层面进行统计,中国(329次)、印度(291次)、印度尼西亚(273次)和美国(197次)洪水发生累计次数多,但因国土面积较大,其单位面积发生次数相对较低。根据图 3b和3c显示,孟加拉国的洪水人口影响程度最大(59 a的累计影响人口为2 710万人/104km2),相当于每年45.9万人/104km2,其次为印度、斯里兰卡、中国、巴基斯坦、泰国、菲律宾等。同时,孟加拉国洪水死亡人数最高,59 a累计值高达3 313人/104km2,其次为海地、委内瑞拉、尼泊尔、斯里兰卡、印度、巴基斯坦等。为了深入理解全球洪水事件的演变趋势,需要深入探讨影响这些趋势的关键风险因素。不同地区洪水发生的差异往往与气候、水文、地质及人类活动等多种因素密切相关。研究这些风险因素的变化趋势对于全面评估洪水风险至关重要。
2.2 全球洪水风险
2.2.1 洪水风险因素时空演变分析
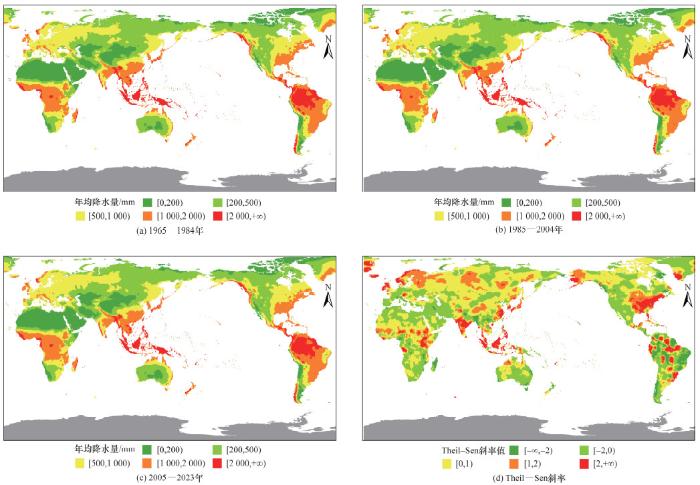
通过对高程(见图 3)分析可知,亚洲的东南亚地区地势低洼,非洲东部高原地带地势较高,南美洲加勒比区域沿海低地和河流三角洲地带地形低,临近加勒比海域。对降水量时空变化(见图 4a和图 5)分析可知,1965—2023年六大洲的降水趋势较为稳定,年平均降水量空间差异明显。撒哈拉沙漠以北的非洲区域降水稀少,年均降水量维持在200 mm以下,而中部热带雨林区降水充沛,南部降水较少,年均低于500 mm。南亚和东南亚降水较高,年均超过500 mm。南美洲的亚马孙流域降水量大,年均超过2 000 mm。欧洲降水量空间分布均匀,基本维持在600~1 000 mm。大洋洲东部群岛降水量大于西部大陆地区降水量。Theil-Sen斜率大于2 mm/a的区域主要位于非洲中部、南亚、东南亚和南美洲。
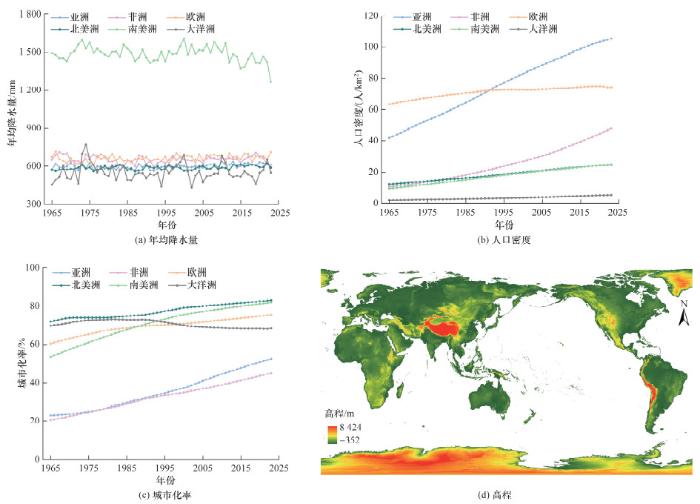
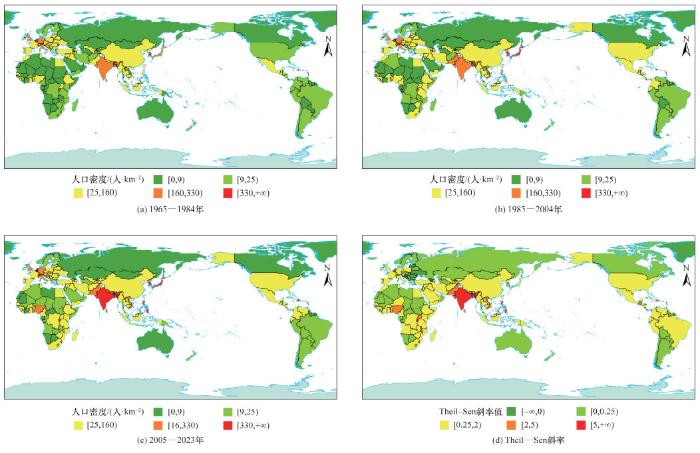
对全球人口密度时间变化(见图 4b)分析可知,亚洲的人口密度显著高于其他大洲,呈现持续上升趋势,从1965年约42人/km2增长至2023年约106人/km2。非洲的人口密度也逐步上升(由11人/km2增长至48人/km2)。欧洲人口密度较大,呈缓慢增长趋势,年均人口密度为70人/km2。北美洲、南美洲和大洋洲的增长较平缓,且人口密度均低于25人/km2。对其进行空间(见图 6)分析可知,人口密集区域集中在南亚、东南亚、欧洲和非洲东部区域。非洲西部沿海地区和东部地区人口密度显著增加(斜率大于0.25人/(km2·a)),到2005—2023年,两区域人口密度超过25人/km2。同期,南亚地区人口密度最高,印度、孟加拉国人口密度超过330人/km2(斜率大于2人/(km2·a)),东南亚国家人口密度为25~160人/km2(斜率为0.25~2人/(km2·a))。拉美和加勒比地区的人口密度也有明显的增长,人口密度大于160人/km2(斜率大于0.25人/(km2·a)。
2.2.2 洪水风险评估结果
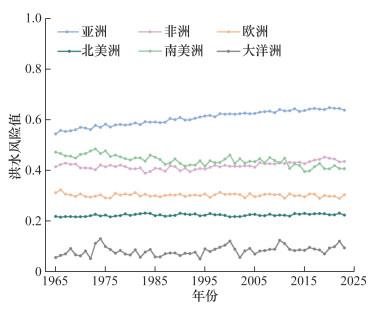
通过熵权法分析得到人口密度和降水是主要影响因素,权重分别为0.33和0.30,表明洪水发生的风险主要受人类活动密集度和降水影响; 城市化率呈负相关,权重为0.22; 地理高程权重最低,为0.15。在1965—2023年期间,全球各大洲的洪水风险呈现明显的区域差异。亚洲的洪水风险值显著高于其他大洲,并且呈逐年上升趋势,显示出人口密度和降水量增加对洪水风险的综合效应。非洲的洪水风险值同样不断增加,反映了该区域人口增长和降水变化的影响。南美洲的洪水风险值在2010年后出现下降,这可能与城市化进程加快使基础设施防御能力增强有关。欧洲和北美洲的洪水风险值保持相对稳定,表明社会经济发展和防洪措施较为成熟。大洋洲的洪水风险虽为最低,但呈现显著的波动,这可能与该地区降水量的波动性密切相关(见图 8)。
3 讨论
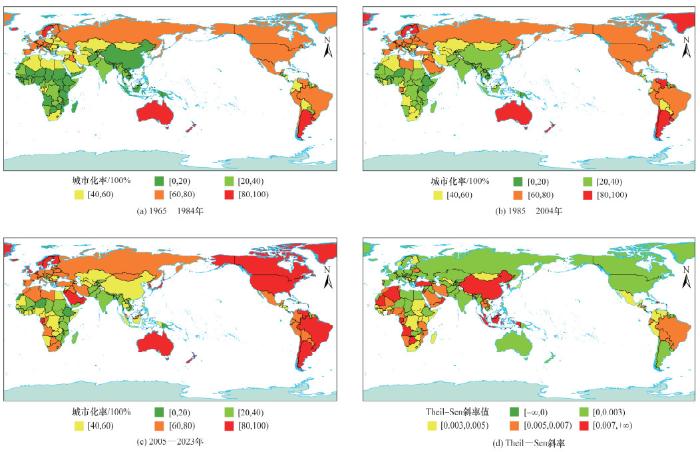
城市化率主要体现城市发展和人口聚集程度,相比之下,国内生产总值(GDP)更能表征全球社会经济发展水平,与脆弱性的关联性更强,但全球尺度的高分辨GDP分布数据不完整,尤其是在一些发展中国家或数据统计不完善的地区。因此未来可选择相关程度更高且数据系列完整的指标来体现社会经济发展水平,从而更准确地表征脆弱性。此外,本文发现大洋洲在1980年代至2000年代的城市化率呈现下降趋势,这与全球城市化上升趋势有所不同。根据相关研究[45]表明大洋洲在1980年代、1990年代和2000年代的城市化率变化幅度分别为-0.59、-2.04和-0.22,这一反常现象可能与城市人口迁移密切相关,尤其是小型岛屿国家的城市扩张受限,导致城市化率的阶段性下降。这一现象反映出人口的洲际流动也可能引起大洋洲城市化的波动。
除此之外,水利工程(如水库、堤防、大坝和蓄滞洪区等)的建设对洪水也有显著影响。水利工程通过调节水量和控制洪水峰值流量,能有效减轻洪水的影响,减少死亡人数和影响人数。同时也应看到,在极端天气条件下,部分水利设施的超负荷使用可能导致工程失效,反而加剧灾害,例如2023年德尔纳的连续溃坝事件[2]。未来的研究可考虑将水利工程纳入洪水风险评估,以提供更全面的防洪减灾决策依据。
EM-DAT数据库来源于联合国、政府和非政府组织、保险公司、研究机构和媒体等多种途径。特别是对于发展中国家和地区,洪水灾害的发生和后续数据报告可能存在时间上的滞后。对六大洲1965—2023年洪水事件和风险演变趋势分析可知,亚洲和非洲的洪水发生次数与风险值Pearson相关系数分别为0.89和0.62。而南美洲的Pearson相关系数为-0.630,呈现负相关,具体而言,其轻灾型洪水事件随着时间的推移逐渐增多,并且与洪水风险呈负相关(Pearson相关系数为-0.58)。这说明尽管洪水事件次数增加,但由于主要为轻灾事件,洪水风险出现了波动降低趋势。与此同时,欧洲、北美洲和大洋洲的洪水发生次数与风险值之间的Pearson相关系数较小,呈现轻微的正相关,表明即便洪水发生次数上升,由于社会经济发展以及防灾减灾措施的不断加强,这些大洲的洪水风险变化较为平稳。因此,下一步研究可进一步探讨相关要素与洪水风险之间的时空演变关系。
4 结论
洪水灾害是影响范围广泛且破坏性极强的自然灾害之一。本文针对1965—2023年的全球洪水事件,从全球、洲际和国家3个层面对洪水发生次数、影响人数和死亡人数进行了趋势分析,揭示了全球洪水事件的时空演变特征。并对洪水风险的3个因素(即危害性、暴露度和脆弱性)进行了分析,揭示了各因素1965—2023年的时空变化趋势,评估了世界六大洲的洪水风险值演变过程。主要结论如下:
1) 从1965年到2023年,全球洪水事件呈现出波动上升的趋势,1990年代末期后,随着防灾减灾能力的提升洪水造成的死亡人数和影响人数达峰值后呈下降趋势。在洲际层面,亚洲、非洲和南美洲洪水发生频繁,累计值分别为2 322次、1 266次和1 084次。在国家层面,海地单位面积洪水发生次数最多(23次/104km2),孟加拉国的单位面积受洪水影响人口的累计值最大(2 710万人/104km2),且死亡人数累计值也最大(3 313人/104km2)。
2) 熵权法分析显示人口密度和降水量对洪水影响程度最大,权重分别为0.33和0.30。1965—2023年,全球各大洲的洪水风险呈现明显的区域差异。亚洲的洪水风险明显高于其他洲的,其洪水风险值和非洲的洪水风险值均显著上升; 南美洲的洪水风险在2010年后下降; 欧洲和北美洲的洪水风险值较低且保持相对稳定; 大洋洲的洪水风险值最低,但波动显著。
本文中数据的可获取性、完整性和质量限制了GDP等经济指标的使用。下一步,将进一步优化指标的选择; 针对暴露度和脆弱性,考虑引入动态指标,以提高对洪水风险的动态评估能力; 同时应考虑水利工程措施的影响,为全球防洪减灾策略和国家(区域)应急预案制定提供科学依据。
