

本研究以中国东北地区红松人工林的地表凋落物为实验材料,开展不同坡度、可燃物载量和含水率条件下的室内燃烧实验,通过观察材料燃烧过程中表现出来的林火行为特征并测定可燃物碳消耗量,分析二者之间的关系并建立地表凋落物燃烧碳消耗预测模型。
1 材料与方法
1.1 可燃物床层设置
本研究于2022年8月在黑龙江省哈尔滨市帽儿山林场内选取典型红松人工林,对2块30 m×30 m的标准地进行每木检尺,测量林分特征。在每块标准地内设置5块1 m×1 m的样方,收集样方内所有地表凋落叶以测量样方内可燃物载量,样方基本信息如表 1所示。测量完成后,以破坏性采样的方式收集大量地表凋落叶,运回实验室内通风保存,为燃烧实验做准备。本研究随机抽取了完整的红松针叶,测量得到其热值为22 478 kJ/kg,表面积体积比为6 864.3 m2/m3,颗粒密度为396.4 kg/m3。
表 1 30 m×30 m标准地基本信息 |
| 林分特征 | 最大值 | 最小值 | 平均值 | 标准差 |
| 胸径/cm | 21.8 | 15.3 | 18.9 | 2.3 |
| 树高/m | 14.6 | 9.7 | 12.2 | 1.3 |
| 冠长/m | 8.6 | 4.6 | 6.5 | 1.4 |
| 冠幅/m | 2.9 | 1.7 | 2.2 | 0.4 |
| 郁闭度 | 1 633.0 | 650.0 | 1 064.8 | 329.5 |
| 可燃物载量/(kg·m-2) | 1.5 | 0.5 | 1.0 | 0.3 |
根据野外调查的可燃物载量范围,本研究将燃烧实验的载量设置为0.4、0.8、1.2、1.6 kg/m2,共4个水平。根据相关研究及前期预实验[21],本研究将可燃物含水率设置为5%、10%和15%,共3个水平。研究区域为低山丘陵缓坡地形,本研究将坡度设置为0°、10°、20°、30°,共4个水平。在本研究中,所有坡度条件下的燃烧实验均为上坡火。
1.2 燃烧试验
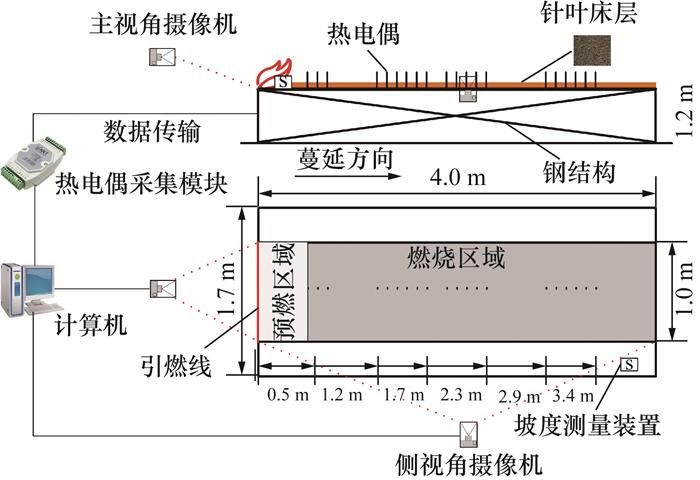
燃烧试验于2022年9~10月的秋季防火期内,在东北林业大学风洞燃烧实验室内的变坡度燃烧床上进行,如图 1所示。本研究将可燃物床层尺寸设置为4 m×1 m,经前期预实验,本研究确定了0.5 m长的预燃区域,当火前锋蔓延经过预燃区域,即认为火已达到“似稳态”,此时开始林火行为特征的测量。在燃烧床中心线距引燃端0.5 m处,每隔0.1 m布设一根热电偶,共计布设20根热电偶(使用温度采集模块将20根热电偶进行组合,使用计算机同步采集温度数据)。在燃烧床的侧方布设一台坡度测量装置,用以确定燃烧床坡度。在燃烧床的正前方及侧方架设2台摄像机,用以记录燃烧过程。每次实验前将10 mL酒精均匀喷在可燃物床层前方以线引燃的方式引燃可燃物,其余实验设置参考文[22]。
本研究共设置4种可燃物载量、3种可燃物含水率和4种坡度(详见1.1节),共计48种工况组合,为减小燃烧实验误差,每种组合进行3次重复实验,共计144场燃烧实验。在实验开始前,使用手持气象站(Kestrel 4500)测量并记录空气温度和湿度。在实验开始前随机抽取少量可燃物并烘干至恒重,用以计算可燃物实际含水率。床层深度是在每平方米可燃物床层的4个随机位置使用钢尺测量的。相同载量、含水率和坡度组合的床层结构在相同的实验条件下完成。
1.3 林火行为特征分析
燃烧实验结束后,收集所有燃烧剩余物进行称重,使用干烧法[24]测量其碳含量,可燃物碳消耗量的计算公式为
其中:Wc为可燃物碳消耗量,kg·m-2;W0为可燃物干重,kg·m-2;C0为凋落叶含碳率,%;Ws为单位面积燃烧剩余物质量,kg·m-2;C为燃烧剩余物含碳率,%。
使用Byram火线强度方程[13],以可燃物热值、可燃物消耗量及蔓延速率计算火线强度。
其中:I为火线强度,kW·m-1;H为可燃物低热值,kJ·kg-1;W为可燃物消耗量,kg·m-2;R为蔓延速率,m·min-1。
1.4 可燃物碳消耗量预测公式和评估方法
除式(2)外,Byram还建立了火焰长度与火线强度的幂指数方程[13]。
其中:Lf为火焰长度,m;a与b为经验系数,原模型中a=258,b=2.17。
将式(2)与式(3)联立后整理得到式(4)。
假设Wc与W之间的关系满足式(5)。
其中:c为拟合系数,d为常数。
将式(5)中拟合得出的c带入式(4)中,得到Wc的预测公式如下:
由于Byram火线强度方程中的a和b是根据当地可燃物的Lf拟合出的经验系数,本研究使用燃烧实验测量数据结合最小二乘法对a和b进行重新拟合,以适用于红松人工林地表Wc的预测。本研究使用平均绝对误差MAE、平均绝对百分比误差MAPE、平均偏差误差MBE和拟合系数R2对模型进行评价,其计算公式如下所示。
其中:yi和$\hat{y}_i$ 分别为第i个工况下的观测值和模型预测值,n为样本数量。
2 结果与分析
2.1 燃烧试验数据基本统计分析
本研究共进行了144场室内燃烧实验,实验所涉及到的环境、可燃物床层和林火行为特征等数据如表 2所示。由表可知,受当地火灾季节的气候影响,空气温度与空气湿度变化范围较大,实验制备的可燃物含水率相对准确,符合实验设置的可燃物含水率梯度。从本研究关注的R、I等关键指标可以看出,144场燃烧实验全部属于低强度地表火灾。
表 2 燃烧实验数据基本统计 |
| 变量 | 最小值 | 最大值 | 平均值 | 标准差 | |
| 环境特征 | 空气温度/℃ | 6.30 | 27.90 | 18.28 | 4.71 |
| 空气湿度/% | 17.20 | 87.10 | 62.96 | 13.89 | |
| 可燃物床层特征 | 床层厚度/cm | 2.03 | 9.17 | 5.14 | 2.00 |
| 实际可燃物含水率/% | 4.42 | 18.01 | 10.32 | 4.07 | |
| 林火行为特征 | R/(m·min-1) | 0.11 | 2.07 | 0.48 | 0.41 |
| Lf/m | 0.08 | 1.22 | 0.57 | 0.24 | |
| W/(kg·m-2) | 0.22 | 1.39 | 0.74 | 0.38 | |
| I/(kW·m-1) | 12.77 | 925.66 | 143.19 | 164.07 | |
| Wc/(kg·m-2) | 0.08 | 0.65 | 0.32 | 0.18 |
2.2 不同影响因素下林火行为特征变化规律
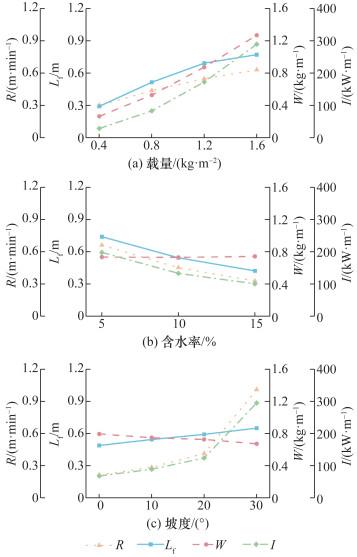
不同影响因素下林火行为特征变化规律如图 2所示。由图 2a可知,各林火行为特征指标随可燃物载量的增加而增加,这是因为可燃物载量的增加,直接提升了参与燃烧的有效可燃物的质量,使得释放出的热量增多,火焰向前方未燃可燃物传递的热量增加。由图 2b可知,R、Lf和I随可燃物含水率的增加而降低,但可燃物含水率对W并无明显的促进或抑制作用。这可能是因为在本研究所设置的含水率梯度范围内,随着含水率的增加会导致可燃物引燃能增加,用于蔓延的热量占比减少,使R等指标降低。同时随着R的降低,火焰的驻留时间随之增加。Reid等[25]对地表细小可燃物的W研究发现,无论初始可燃物含水率是多少,可燃物在燃烧的预热阶段均被干燥至相似的可燃物含水率水平,使得可燃物含水率对W无显著影响。在接下来的研究中,应设置更多的可燃物载量和可燃物含水率梯度,进一步分析可燃物含水率对W的影响。由图 2c可知,坡度对R、Lf和I有明显的促进作用,对W有明显的抑制作用。这是因为随着坡度的增加,火焰更加贴近前方未燃可燃物,且坡度使Lf增加,从而导致可燃物到达引燃温度的时间缩短,使火焰驻留时间缩短。从R随坡度增加的趋势来看,当坡度为0°~20°时,R增加较缓;当坡度从20°增加至30°时,R增长了一倍以上。这可能是因为坡度对R的影响呈指数关系。从传热角度考虑,在坡度增加过程中,火焰与前方未燃可燃物之间的夹角减小,在20°坡度以下,坡度导致火焰与前方未燃可燃物之间的夹角减小,使火焰的辐射传热能力增加,表现为R和I缓慢增加。当坡度增加至20°以上时,火焰更加靠近前方未燃可燃物,此时火焰传热由辐射传热为主转变为对流传热为主,从而表现为R和I增加显著。本研究中,传热方式的转变可能在20°左右。Dupuy等[26-27]发现坡度为0°~20°条件下,可燃物床层间的辐射传热在火蔓延传热影响机制中占据主导地位,在20°坡度以上,可燃物床层间的辐射传热不再增加,甚至略有下降,而对流加热增加显著,对流加热是影响R增加的主导因素,与本研究结论相同。Drysdale等[28]以聚甲基丙烯酸甲酯(PMMA)为实验材料进行燃烧实验,发现R显著变化发生在坡度15°~20°之间,与本研究结论类似。因此在后续进行坡度对R的影响研究时,应设置更多且更小的坡度梯度,来确定辐射和对流在不同坡度下所占比例和临界坡度。
各影响因素两两交互作用对林火行为特征的方差分析结果如表 3所示,其中F为统计量,P为显著性值。可以看出,不同影响因素的交互作用对所有的林火行为特征均具有极显著的影响(P < 0.01)。
表 3 方差分析 |
| 变量 | 因变量 | 均方 | F | P |
| 载量和含水率 | R | 0.042 | 22.371 | < 0.01** |
| Lf | 0.044 | 126.232 | < 0.01** | |
| W | 0.002 | 2.644 | < 0.05* | |
| I | 17 884.166 | 64.412 | < 0.01** | |
| 载量和坡度 | R | 0.23 | 122.79 | < 0.01** |
| Lf | 0.006 | 17.018 | < 0.01** | |
| W | 0.007 | 10.535 | < 0.01** | |
| I | 73 985.167 | 266.256 | < 0.01** | |
| 含水率和坡度 | R | 0.362 | 193.446 | < 0.01** |
| Lf | 0.027 | 77.215 | < 0.01** | |
| W | 0.003 | 4.21 | < 0.01** | |
| I | 28 626.438 | 103.098 | < 0.001** |
注:*表示显著相关,* *表示极显著相关。 |
2.3 红松地表可燃物碳消耗量模型构建
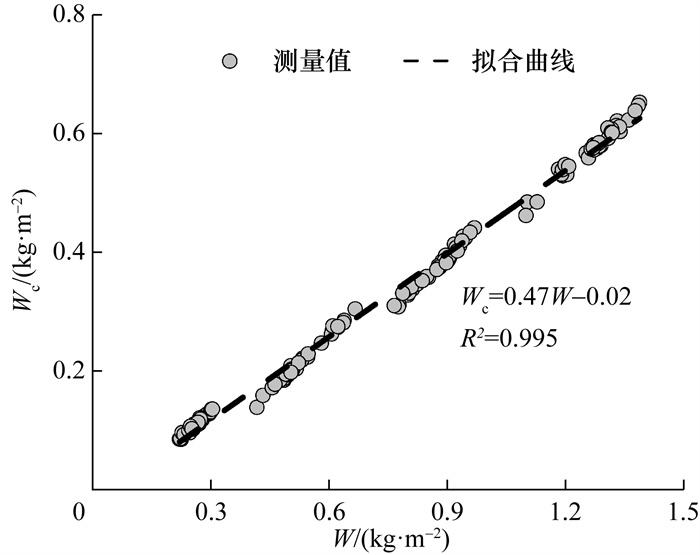
W与Wc的拟合关系如图 3所示,可以由图得出式(5)中的拟合系数c=0.47。
将c=0.47带入式(6)中拟合得到a=381.21,b=2.42。因此红松人工林地表Wc的预测模型为
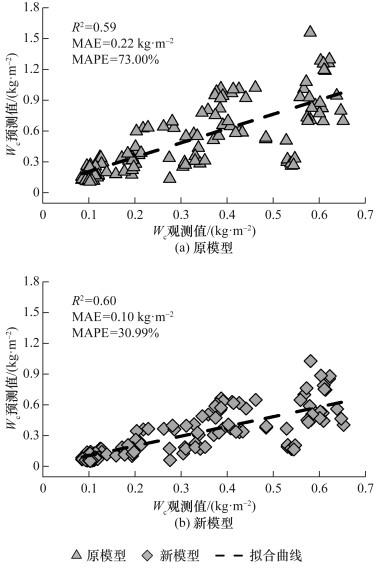
使用Byram模型与拟合参数后的新模型对Wc进行预测,结果如图 4所示。由图可知,使用拟合参数后,模型预测的R2上升了0.01,MAE下降了0.12 kg/m2,MAPE下降了42.01%,表明模型预测精度有了显著提升。
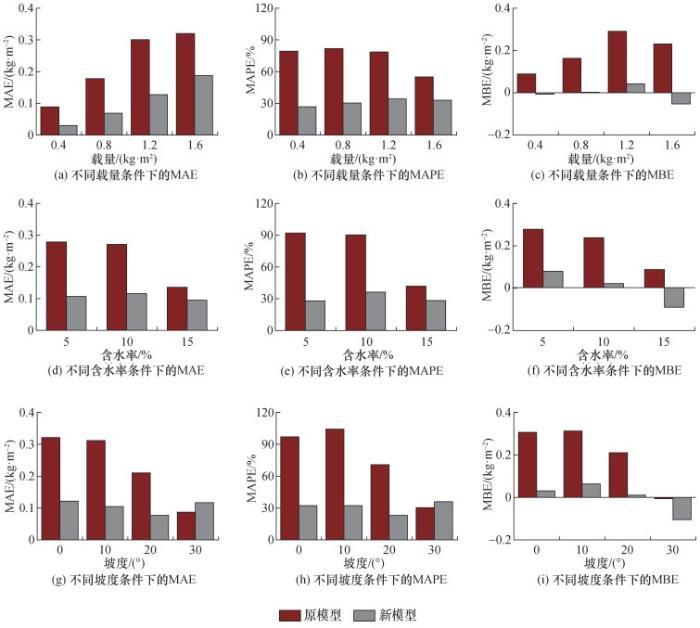
2.4 不同影响因素下模型误差分析
图 5是使用原Byram参数值和拟合参数值后MAE、MAPE和MBE在不同影响因素下的变化特征。在本研究设置的梯度范围内,使用Byram模型原参数预测Wc的精度较差,这是因为Byram火线强度方程是使用美国可燃物的火灾数据集建立的,该火灾数据集包括可燃物类型的变化和对整个景观可燃物特征的估计,使得该数据集较为粗糙[29],导致输入数据的可靠性和方程的内部精度较低,从而使得预测结果较差[30]。新模型对Wc预测产生的误差与原模型相比有了显著下降,这说明在构建模型时应根据当地可燃物类型燃烧实验的结果对模型参数进行重新拟合,同时应将实验设计得较为可靠,包含较广泛的地表火灾行为,以及获取的实际火灾数据较为准确[31],从而提升模型的适用性与准确性。从MBE的变化特征来看(见图 5c、5f和5i),除坡度为30°外,原模型高估了Wc,新模型在高载量(1.6 kg/m2)、高含水率(15%)和高坡度(30°)条件下低估了Wc,但结合MAE和MAPE来看,新模型仅在坡度为30°时的误差高于原模型,这可能是因为在坡度较高时R过快,同时在坡度的作用下火焰产生的斜坡风使火焰来回抖动,造成了一定的测量误差。Cheney等[32]在使用独立数据对模型评估的结果表明,森林火灾数据的低可靠性导致模型预测的MAE值是可靠数据的两倍以上。本研究基于对地表火灾环境动力学的经验积累与理解、对模型局限性的理解和使用实际火灾数据对模型参数进行拟合,使得新模型预测精度有了显著提升,Cruz等[33]使用1 278个森林火灾数据对49个火灾模型进行适用性分析,发现模型预测误差为35%可以看作合理的模型性能标准,因此本研究所构建的新模型(MAPE=30.99%)可用于红松人工林地表Wc的预测。
3 结论
本研究通过室内燃烧实验测量了不同可燃物载量(0.4、0.8、1.2和1.6 kg/m2)、含水率(5%、10%和15%)和坡度(0°、10°、20°和30°)条件下的林火行为特征,并基于实验数据对重新整理后Byram火线强度方程参数进行了拟合,建立了红松地表可燃物碳消耗量Wc的预测模型。主要结论如下:
1) 不同影响因素对林火行为特征的影响与森林燃烧原理基本一致,但研究发现,在本研究设计可燃物含水率梯度范围内,其对可燃物消耗量W并无显著影响。
2) 本研究对原Byram火线强度方程进行了重新整理使之转变为Wc预测模型,然后基于室内燃烧实验实测数据对方程重新拟合后,模型预测精度显著提升,为中国本土Wc模型的构建提供了新的路径及方法。
3) 本研究设置的坡度、可燃物载量和含水率虽尽可能还原了野外地表凋落物的真实状态,但铺设的可燃物床层仍与野外真实情况存在一定差异。基于对火灾预测模型的迫切需求,在后续研究中会将室内燃烧实验、计划火烧和真实火灾数据相结合,进一步改进火行为模型。
