Shenzhen-Zhongshan Link

Erection procedure optimization of a long-span suspension bridge considering flutter risk in mixed wind climates

  • Teng MA 1, 2 ,
  • Bingyao CHEN 3 ,
  • Wei CUI , 1, 2, * ,
  • Huanyong CHEN 4 ,
  • Shenyou SONG 4 ,
  • Lin ZHAO 1, 5
Expand
  • 1. State Key Laboratory of Disaster Reduction in Civil Engineering, Tongji University, Shanghai 200092, China
  • 2. Key Laboratory of Transport Industry of Wind Resistant Technology for Bridge Structures, Tongji University, Shanghai 200092, China
  • 3. Guangdong Bay Area Transportation Construction Investment Co., Ltd., Nansha 510030, China
  • 4. Shenzhen-Zhongshan Link Administration Center, Zhongshan 528400, China
  • 5. State Key Laboratory of Featured Metal Materials and Life-cycle Safety for Composite Structures, Guangxi University, Nanning 530004, China

Received date: 2024-05-11

  Online published: 2025-06-26

Copyright

All rights reserved. Unauthorized reproduction is prohibited.

Abstract

Objective: During the erection stage of suspension bridges, the critical flutter wind speed varies continuously owing to changes in structural dynamic properties, including mass and stiffness. Concurrently, the wind climate fluctuates seasonally or even monthly throughout the bridge erection process. To evaluate the flutter risk of suspension bridges exposed to varying wind conditions, a framework is proposed to optimize the deck erection timeline under complex wind climates, with a summary of the flutter risk flow. Methods: The aerodynamic flutter stability for each construction stage was tested by full-model wind tunnel tests. The time-varying wind climate is represented as an extreme wind speed annual exceedance probability distribution function for each month. Data for synoptic wind speed analysis were extracted from the National Oceanic and Atmospheric Administration (NOAA) Global Integrated Surface Dataset, while tropical cyclone wind speeds were modeled using Vickery's full-track Monte Carlo simulations. The mixed extreme wind speed, resulting from the combination of tropical cyclones and monsoons, was calculated using probability theory for independent events. An optimization algorithm was used to determine the optimal deck erection starting timeline to minimize on-site flutter probability during the entire deck erection construction process. Results: Two specific analytical methods and visualizations were proposed. The flutter risk flow illustrates the flutter performance of a single program, while the erection flutter risk box plot provides a horizontal comparison of different erection processes. The study also discussed how to choose the best deck erection plan for different erection procedure configurations. The Shenzhong Link, built on the southern coastline of China, served as a case study. A full-bridge aeroelastic model wind tunnel test was conducted to determine the critical flutter speed at different erection stages. As the construction of the main beam progressed, the critical wind speed of the bridge generally increased. In addition, a negative angle of attack was detrimental when the main beam assembly rate was low, while a positive angle of attack was unfavorable at higher assembly rates. Extreme wind speeds from typhoons and synoptic winds were analyzed using Monte Carlo typhoon simulations and meteorological data statistics, respectively. The results indicated strong seasonality in coastal mixed climates owing to typhoon influence. The optimization algorithm identified an optimal timeline for the Lingdingyang Bridge, minimizing flutter risk. However, selecting the worst timeline could exponentially increase flutter risk. Conclusions: This paper proposes a construction process optimization strategy for suspension bridge girder that minimizes the flutter risk during the overall construction process. The mixed climatic wind environment including typhoons and benign winds and the continuous time-varying bridge structure state are considered, and the time-varying construction period flutter probability is calculated. Research has shown that timeline optimization is a more economical and viable approach than structural and aerodynamic interventions, especially in mixed wind climates. Horizontal comparison of desk erection plans should consider not only the lowest flutter speed but also the flutter risk probability across all timelines. The erection risk box plot is an effective tool in this case. If the erection starting time is flexible, minimizing the flutter probability should be the main indicator. When the timeline is uncertain, greater attention should be given on the mean-value and quartile box indicators.

Cite this article

Teng MA , Bingyao CHEN , Wei CUI , Huanyong CHEN , Shenyou SONG , Lin ZHAO . Erection procedure optimization of a long-span suspension bridge considering flutter risk in mixed wind climates[J]. Journal of Tsinghua University(Science and Technology), 2025 , 65(7) : 1284 -1290 . DOI: 10.16511/j.cnki.qhdxxb.2025.26.012

随着桥梁结构长大化发展,桥梁风致响应越来越明显[1],悬索桥抗风问题逐渐成为大跨悬索桥设计的重要控制环节之一[2]。为验证和研究悬索桥的风致稳定性,可采用风洞试验、数值模拟和理论分析等方法[3]估算和优化桥梁颤振临界风速[4],从而保证桥梁在全寿命期内的抗风安全。
悬索桥施工期的抗风稳定性显著弱于运营期[5]。悬索桥在主梁架设阶段的整体刚度明显小于成桥时的整体刚度,主要原因是桥面整体扭转刚度缺乏整体连续性[6]。一般而言,施工期的主梁颤振临界风速显著低于成桥阶段。自20世纪60年代以来,为保证主梁架设阶段的安全,许多桥梁都在边界层风洞中进行了试验,如英国Severn Bridge[7]、丹麦Great Belt Bridge[8]和中国西堠门大桥[9]。文献研究量化分析了影响施工期桥梁颤振稳定性的一些重要因素,如动力特性[10]、振型[11]、质量偏心[12]和施工顺序[13]等。研究结果表明:由于桥梁结构状态不断变化,因此,施工阶段的颤振风险呈连续变化的特征。
在桥梁主梁施工过程中,除了桥梁的气动稳定性变化外,桥址处的风环境也在随季节连续变化。中国东南沿海地区具有典型的混合气候特征,大风过程主要由良态风和台风组成[14]。台风的季节性导致极值风速在施工过程中连续变化。一般而言,悬索桥施工可以通过避开台风高发季节降低颤振风险。然而,随着桥梁跨度和施工复杂度的增加,桥梁主梁施工过程可能超过1 a[15]。因此,对于在建大跨悬索桥来说,难以避免在台风季节继续施工。
与结构措施和气动措施相比[16],优化主梁施工流程是一种更经济的颤振风险优化手段。本文提出了时变混合风环境下,考虑颤振风险的桥面架设过程优化方法。首先,以深中通道主航道桥伶仃洋大桥为工程应用实例,通过全桥气弹风洞试验测试桥梁各施工阶段的颤振临界风速;其次,计算良态风与台风混合气候下,深中通道桥址处每月的极值风速超越概率,其中,良态风数据样本取自美国国家海洋和大气管理局(National Oceanic and Atmospheric Administration,NOAA)全球综合地表数据库[17],台风风速样本由Vickery全路径模拟方法[18]得到;最后,总结施工期颤振风险分析方法,直观展示不同施工时间安排下,每个施工阶段和整体施工期内的颤振风险,以选择最优的时间安排,避开最不利的施工流程。

1 施工阶段抗风稳定极限

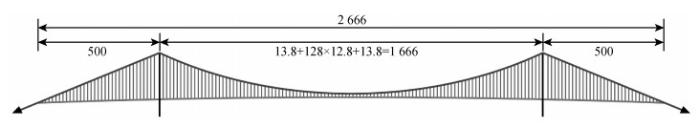
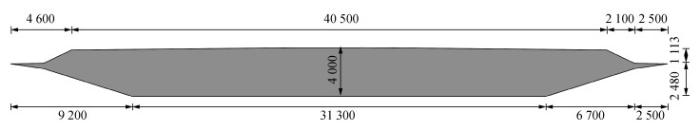
深中通道伶仃洋大桥为双门型桥塔平行索面整体钢箱梁悬索桥,是连接广东省深圳市与中山市的重要跨江通道,跨径组合为500 m+1 666 m+500 m,主梁宽度为49.7 m。本文以深中通道伶仃洋大桥为例,研究了不同施工阶段,悬索桥颤振临界风速的变化。

1.1 全桥气弹模型风洞试验

伶仃洋大桥的主桥总体布置图和施工阶段主梁典型断面图分别如图 12所示。本文考虑同济大学3号边界层风洞(TJ-3,试验段宽15 m,高2 m,长14 m)的实际条件,以及原型结构与气弹模型设计的相似原则,确定模型缩尺比为1∶215,设计模型考虑Froude数一致性条件,因此模型与实桥风速比为1∶14.66。
图 1 主桥总体布置图(单位:m)
图 2 施工阶段主梁典型断面图(单位:mm)

1.2 试验工况与结果

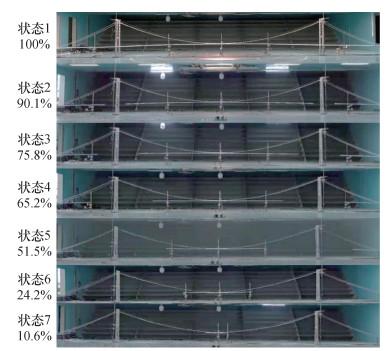
伶仃洋大桥主梁施工采用跨中到桥塔的对称拼装方案。全桥气弹试验根据数值计算结果将整体施工流程划分为7个典型阶段,拼装率分别为100%、90.1%、75.8%、65.2%、51.5%、24.2%和10.6%。试验采用倒拆法,先安装成桥状态的模型,再逐步分状态拆分为前序施工阶段。安装在风洞中的伶仃洋大桥7个典型施工状态的气动弹性模型如图 3所示。
图 3 典型施工状态
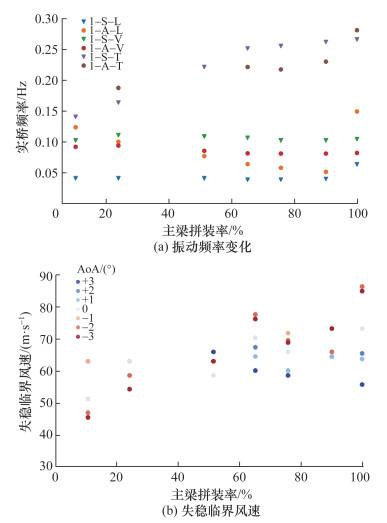
伶仃洋大桥在主梁拼装过程中,一阶振动频率的变化趋势如图 4a所示。一阶正对称侧弯1-S-L、一阶正对称竖弯1-S-V和一阶反对称竖弯1-A-V的频率均随着拼装完成率的上升而保持不变;一阶反对称侧弯1-A-L、一阶正对称扭转1-S-T和一阶反对称扭转1-A-T的频率均随着拼装完成率的上升而呈不同趋势变化。其中:1-A-L呈下降趋势,1-S-T和1-A-T呈上升趋势。全桥气弹试验在均匀流场下进行,主要考察桥梁的静风稳定性和颤振稳定性。桥梁的气动稳定极限由不同施工状态在均匀流场下的临界风速表示。由于桥址处来流风攻角不断变化,因此开展全桥气弹模型试验时考虑了-3°~+3°、间隔1°的7种风攻角情况。均匀流工况下,不同施工阶段伶仃洋大桥的失稳临界风速如图 4b所示,包含7个施工阶段,每个施工阶段包含7个风攻角(angle of attack, AoA)。由图 4b可知,随着主梁拼装率的提高,桥梁失稳临界风速总体呈升高趋势。此外,在主梁拼装率较低时,负攻角为不利工况,而在主梁拼装率较高时,正攻角为不利工况。
图 4 不同施工阶段伶仃洋大桥的振动频率变化和失稳临界风速

2 混合气候月极值风速

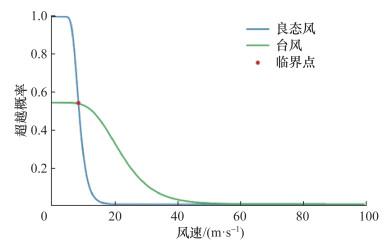
极端风速超越概率在不同季节变化较大,特别是在由台风与良态风组成的混合气候区间。混合气候下的极端风速计算需要对不同的风气候进行单独的极值分析,然后再综合成混合极值分布。以深中通道桥址为例,其位于中国南部沿海珠江口,主要受台风和良态风影响。因此本文主要研究台风与良态风组成的混合气候。良态风极值风速可直接基于现有实测风速数据的概率分布估计,而台风则需要开展随机模拟,用大量风速样本进行概型拟合和风速预测。

2.1 台风全路径模拟

由于实际的台风样本太少,无法进行可靠的极值统计分析,因此本文引入台风模拟评估桥址处的台风极值风速。台风模拟和设计风速预测主要分为以下3个步骤:1) 基于历史数据随机生成大量台风路径样本,主要包含各时刻的台风位置信息(路径模型)和中心气压(强度模型)等;2) 将每个时刻的路径数据输入台风风场模型,计算并生成目标场地的台风风速样本;3) 结合模拟年限,预测各重现期极值风速。
本文利用Vickery等[18]提出的台风全路径模拟(full-track simulation)方法和历史台风的起点、轨迹及强度的统计特性生成模拟台风的结果,从而构成足量的台风样本。Vickery轨迹模型模拟了台风的移动速度c、方向θ和相对强度I,分别表示如下:
$\Delta \ln c=a_0+a_1 \varPhi+a_2 \lambda+a_3 \ln c_i+a_4 \theta_i+\epsilon_c, $
$\Delta \theta=b_0+b_1 \varPhi+b_2 \lambda+b_3 \ln c_i+b_4 \theta_i+\epsilon_\theta, $
$\begin{gathered}\ln \left(I_{i+1}\right)=d_0+d_1 \ln \left(I_i\right)+d_2 \ln \left(I_{i-1}\right)+ \\d_3 \ln \left(I_{i-2}\right)+d_4 T_{\mathrm{s}}+d_5 \Delta T_{\mathrm{s}}+\epsilon_I .\end{gathered}$
其中:ai, bi, di (时间步i=0, 1, 2, …)均为从历史气象数据中识别的待定系数;Φλ分别为台风中心的纬度和经度;ciθi分别为台风在第i时间步的移动速度和方向,θ=0表示正北方;Ts为海平面温度,ΔTs为第ii+1时间步的海平面温度差;$\epsilon_c, \epsilon_\theta, \epsilon_I$均为拟合残差。
Vickery模型利用强度衰减模型描述台风登陆后能量的衰减,表示如下:
$\Delta p(t)=\Delta p_0 \mathrm{e}^{-a t_{\mathrm{h}}}, $
$a=A_0+A_1 \Delta p+\epsilon_a .$
其中:Δp(t)为台风中心压差;Δp0为台风登陆时的压差;a为压差随时间th的指数衰减率;A0A1均为与场地相关的参数;$\epsilon_a$为拟合残差。
本文利用Vickery模型进行了20 000 a的台风全路径模拟,并获取了台风路径记录距深中通道桥址处小于300 km的所有台风数据集合。台风的极值样本用独立风暴法生成,即每次台风提取极值风速。本文采用Gumbel分布拟合得到每次台风极值风速的分布参数,其概率分布函数表示如下:
$P(u <U)=\exp \left(-\exp \left(-\frac{U-\beta}{\alpha}\right)\right) .$
其中:u为台风极值风速;U为风速;P(u < U)为u < U的概率;βα分别为位置参数和尺度参数。根据概率分布函数和Poisson过程可以计算T年内极值风速的超越概率PT(u < U),表示如下:
$P_T(u <U)=\exp (-r T(1-P(u <U))) .$
其中r为每年发生台风的次数。
本文以深中通道伶仃洋大桥桥址处为例,12个月中,台风极值风速的分布情况如图 5a所示,7—9月,深中通道桥址处台风的发生概率和发生强度均显著高于其他月份。不同月份的风速超越概率可通过式(7)得到。台风极值风速对季节和月份的敏感性如图 5b所示。
图 5 不同月份深中通道桥址处台风极值风速的统计直方图和超越概率

2.2 良态风气象数据

除台风外,良态风产生的极值风速对评估桥梁抗风设计风速也十分重要。良态风极值风速可直接基于现有实测风速数据的概率分布估计。本文将NOAA全球综合地表数据库作为良态风环境数据源。该数据库由全球约3万个气象站的观测数据组成,包括风向和风速等。深圳宝安国际机场气象站(编号:594930)距深中通道桥址处最近。
气象站数据主要用于分析良态风对极值风速的贡献。从台风最佳路径数据集中提取台风路径距离气象站小于300 km的气象站风速记录,这部分风速记录被认为是受台风影响的。良态风的极值样本是在去除台风结果后取每年的最大风速。通过Gumbel分布拟合极值样本,得到Gumbel分布的位置参数和尺度参数。12个月中,良态风的极值风速超越概率如图 6a所示,良态风极值风速超越概率的季节波动比台风弱,但仍存在风速较大的月份,如3、5、6、7、8、9月等。
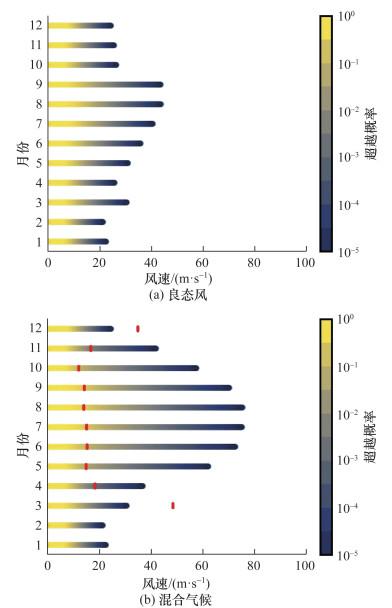
图 6 不同月份深中通道桥址处良态风和混合气候的极值风速超越概率

2.3 混合气候极值风速

本文将良态风和台风视为2个独立的随机事件,混合气候风速超越概率可看作良态风和台风均未超过给定风速的补集,表示如下:
$P_T(u>U)=1-P_T\left(u_{\mathrm{N}} <U\right) \cdot P_T\left(u_{\mathrm{T}}<U\right) .$
其中:PT(u>U)为T年内混合气候风速超越U的概率,PT(uN < U)为T年内良态风风速不超越U的概率,PT(uT < U)为T年内台风风速不超越U的概率,超越概率采用Poisson过程计算。
不同月份,深中通道桥址处混合气候的极值风速超越概率如图 6b所示,本文考虑了良态风和台风极端气候的混合超越概率,其中红色短线为台风控制或良态风控制的临界点。良态风通常控制低风速的超越概率(低重现期)。台风发生越频繁,临界点越向高风速移动。台风控制和良态风控制的临界点如图 7所示。受台风影响,沿海地区的混合气候具有很强的季节性。在图 6b中,1、2、3、12月的台风-良态风临界点在超越概率线之外(1、2月在无穷远处),该月台风发生的概率极低,临界超越概率低于10-4
图 7 良态风与台风控制极值风速的临界示意图

3 施工期颤振风险评估

大跨悬索桥架设过程中的颤振失稳风险对施工期内的桥梁状态变化和极值风速变化非常敏感。在主梁架设过程中,临界颤振风速是连续变化的。此外,由于沿海台风的影响,桥址处极值风速在不同月份也会变化。通常,施工状态的抗风研究指标仅为施工全过程中最不利颤振临界风速,严重低估了桥梁施工状态的抗风性能。对于极值风速,传统研究的设计风速为全年极值风速,并未考虑极值风速随月份的动态变化。因此,本文提出一种动态颤振失效概率计算方法,考虑了所有施工状态的颤振失效的总概率,与颤振概率有关的施工因素包括开始施工时间和进展。

3.1 颤振概率

特定施工状态的悬索桥颤振失效概率指桥址处风环境下,风速超过风洞试验颤振临界风速的概率,表示如下:
$P_e=1-\prod\nolimits_m^{m+q} P\left(u_m <U_{\mathrm{f}}\right) .$
其中:e为施工阶段编号;m为该施工阶段开始的月份;P(um < Uf)为该月份极值风速概率密度函数,Uf为该施工阶段的颤振临界风速;q为该施工阶段持续的月份数。
由于不同施工阶段的颤振临界风速相互独立,因此整个施工期内发生颤振的概率P(flutter)可以认为是每个阶段发生颤振概率Pj的乘积,表示如下:
$P(\text { flutter })=1-\prod\nolimits_{j=1}^n P_j .$
其中: n为典型施工状态数量; j为当前施工状态编号。

3.2 施工流程优化

通过优化主梁架设过程,可降低桥面架设过程中颤振失效的概率。本文假设主梁架设过程连续,各施工阶段之间无间隙。优化开始施工时间可以避免同时出现极端风况和低颤振临界风速等不利状态。若桥梁主梁架设过程和架设速度已确定,则必然存在使施工期内桥梁总颤振风险最低的最佳开始施工时间。本文定义了施工期颤振风险,包括在不同月份开始施工时,每个施工阶段的颤振风险和总颤振风险。深中通道伶仃洋大桥的施工期颤振风险流程如图 8所示,颤振临界风速来自全桥气弹模型风洞试验(见图 4b),极值风速采用混合气候计算理论(见图 6b),以月度衡量每个典型施工阶段。
图 8 深中通道施工期的颤振失效概率流程图
每个施工阶段和整个施工期的颤振失效概率如图 8所示,即使施工方案完全一致,施工开始时间不同会导致悬索桥架设过程的颤振风险完全不同。以深中通道为例,当选择1月份开始施工时,总失效概率约为10-10;而当选择最不利的8月份开始施工时,总颤振失效概率约为1.25×10⁻³

4 结论

本文提出了考虑整体施工过程颤振风险最小的悬索桥主梁施工流程优化策略,考虑了台风与良态风混合气候风环境及连续时变桥梁结构状态,计算了随时间变化的施工期颤振概率。此外,本文还提出了施工期颤振风险流程图,可直观地展示每个施工阶段和整个施工期的颤振失效概率分布关系。
本文以中国沿海深中通道伶仃洋大桥为例,通过全桥气弹风洞试验测试了不同施工阶段的颤振临界风速,并利用混合气候理论计算极值风速超越概率。由施工期颤振风险分析可知,深中通道主桥颤振风险对主梁架设流程和时间安排非常敏感,最佳时间线与最差时间线在施工期颤振风险上存在7个数量级的差异。因此,优化施工时间是一种比传统结构方法或气动措施更经济有效的方法。
1
DING Y J , ZHAO L , XIAN R , et al. Aerodynamic stability evolution tendency of suspension bridges with spans from 1000 to 5000 m[J]. Frontiers of Structural and Civil Engineering, 2023, 17 (10): 1465- 1476.

DOI

2
陈政清. 桥梁风工程[M]. 北京: 人民交通出版社, 2005.

CHEN Z Q . Bridge wind engineering[M]. Beijing: China Communications Press, 2005.

3
黄成造, 赵林, 宋神友, 等. 全离岸海中超大跨径悬索桥抗风关键技术研究[M]. 北京: 人民交通出版社, 2024.

HUANG C Z , ZHAO L , SONG S Y , et al. Research on key technologies of wind resistance of super long-span suspension bridge in offshore sea[M]. Beijing: China Communications Press, 2024.

4
ZHAO L , CHENG Y , LIU S Y , et al. Instantaneous power balance algorithm for flutter critical wind speed prediction of bridge girders[J]. Journal of Engineering Mechanics, 2024, 150 (2): 04023120.

DOI

5
项海帆, 葛耀君. 大跨度桥梁抗风技术挑战与基础研究[J]. 中国工程科学, 2011, 13 (9): 8- 21.

DOI

XIANG H F , GE Y J . Wind resistance challenges and fundamental research on long-span bridges[J]. Strategic Study of CAE, 2011, 13 (9): 8- 21.

DOI

6
ZHANG X J . Investigation on aerodynamic stability of long-span suspension bridges under erection[J]. Journal of Wind Engineering and Industrial Aerodynamics, 2004, 92 (1): 1- 8.

DOI

7
BAKIS K N , LIMEBEER D J N , WILLIAMS M S , et al. Passive aeroelastic control of a suspension bridge during erection[J]. Journal of Fluids and Structures, 2016, 66, 543- 570.

DOI

8
LARSEN A . Aerodynamic aspects of the final design of the 1624 m suspension bridge across the Great Belt[J]. Journal of Wind Engineering and Industrial Aerodynamics, 1993, 48 (2-3): 261- 285.

DOI

9
YANG Y X , ZHANG L , DING Q S , et al. Flutter performance and improvement for a suspension bridge with central-slotted box girder during erection[J]. Journal of Wind Engineering and Industrial Aerodynamics, 2018, 179, 118- 124.

DOI

10
GE Y J , TANAKA H . Aerodynamic stability of long-span suspension bridges under erection[J]. Journal of Structural Engineering, 2000, 126 (12): 1404- 1412.

DOI

11
SVENSSON H S, KOVACS I. Examples of analytical aerodynamic investigations of long-span bridges[M]// LARSEN A. Aerodynamics of Large Bridges. London: Routledge, 2017: 171-182.

12
LARSEN A . Prediction of aeroelastic stability of suspension bridges during erection[J]. Journal of Wind Engineering and Industrial Aerodynamics, 1997, 72, 265- 274.

DOI

13
ARCO D C D , APARICIO A C . Improving the wind stability of suspension bridges during construction[J]. Journal of Structural Engineering, 2001, 127 (8): 869- 875.

DOI

14
CUI W , MA T , ZHAO L , et al. Data-based windstorm type identification algorithm and extreme wind speed prediction[J]. Journal of Structural Engineering, 2021, 147 (5): 04021053.

DOI

15
MIYATA T , YAMAGUCHI K . Aerodynamics of wind effects on the Akashi Kaikyo Bridge[J]. Journal of Wind Engineering and Industrial Aerodynamics, 1993, 48 (2-3): 287- 315.

DOI

16
ZHENG J , FANG G S , WANG Z L , et al. Shape optimization of closed-box girder considering dynamic and aerodynamic effects on flutter: A CFD-enabled and Kriging surrogate-based strategy[J]. Engineering Applications of Computational Fluid Mechanics, 2023, 17 (1): 2191693.

DOI

17
SMITH A , LOTT N , VOSE R . The integrated surface database: Recent developments and partnerships[J]. Bulletin of the American Meteorological Society, 2011, 92 (6): 704- 708.

DOI

18
VICKERY P J , SKERLJ P F , TWISDALE L A . Simulation of hurricane risk in the U.S. using empirical track model[J]. Journal of Structural Engineering, 2000, 126 (10): 1222- 1237.

DOI

Outlines

/