Advanced Ocean Energy Technology

Wave energy focusing investigation of a parabolic wave energy focusing device

  • Maokun GE 1, 2 ,
  • Dezhi NING , 1, 2, * ,
  • Rongquan WANG 1, 2 ,
  • Yichao SUN 1, 2
Expand
  • 1. State Key Laboratory of Coastal and Offshore Engineering, Dalian University of Technology, Dalian 116024, China
  • 2. Dalian Key Laboratory of Offshore Renewable, Dalian University of Technology, Dalian 116024, China

Received date: 2024-09-27

  Online published: 2025-07-24

Copyright

All rights reserved. Unauthorized reproduction is prohibited.

Abstract

Objective: Ocean wave energy is an indispensable part of China's efforts to achieve carbon neutrality and contribute to the energy transition as a green renewable energy. However, the wave energy density in the coastal area is low, and the efficiency of wave energy converters placed there is also low. By optimizing the structural form and spatial layout of the WEC, or optimizing the parameters of the energy conversion system, the efficiency can be improved, but to a limited extent. In order to increase the wave energy captured by the WEC at the source, a parabolic wave energy focusing device is proposed, and the parabolic wave energy focusing device can concentrate wave energy into a certain area. The concentrated energy characteristics of parabolic wave energy focusing device are investigated, the suggestions and references for the integration of the device and WEC also provided. Methods: The concentrated energy characteristics of parabolic wave energy focusing device are investigated through physical model experiments and numerical simulation, and the influence of the focal distance change of parabolic wave energy focusing device on the focusing effect of wave energy is analyzed under different wave period conditions. The Boussinesq equation with improved dispersive characteristics is used to simulate the waves, and the cut-cell technique is used to solve the Boussinesq equations with complex structural boundaries. The Boussinesq equation is solved by an explicit second-order MUSCL-Hancock Godunov-type finite volume scheme, and the HLLC approximate Riemann solver is used to evaluate interface fluxes. The physical experiments were conducted in the 24-meter-wide wave basin at the State Key Laboratory of Coastal and Offshore Engineering, Dalian University of Technology, China. The chord length l, and the focal length, Lf, of the parabolic wave energy focusing device, were 18 and 4.22 m, respectively. Results: The numerical simulation results are consistent with the physical experimental results. All the results showed that: 1) With the change of focal distance and incident wave period, the wave energy focusing point reciprocate periodically around the theoretical focal point; 2) When the ratio of focal distance to half wavelength is approximately an integer multiple, the wave energy focusing point coincides with the theoretical focal point; 3) The smaller the focal distance or the shorter the wave period, the better the wave energy focusing effect at theoretical focal point; 4) The wave energy focusing area is symmetrically distributed along the chord length with the theoretical focal point as the center, and with the decrease of the focal distance, the wave energy focusing effect on the side of the wave incident direction is gradually weakened. Conclusions: By physical model experiment and numerical simulation, the concentrated energy characteristics of parabolic wave energy focusing device are investigated. The parabolic wave energy focusing device can concentrate wave energy into a certain area, and significantly increase the wave energy captured by the WEC. Thus, the efficiency of the wave energy converters can be improved.

Cite this article

Maokun GE , Dezhi NING , Rongquan WANG , Yichao SUN . Wave energy focusing investigation of a parabolic wave energy focusing device[J]. Journal of Tsinghua University(Science and Technology), 2025 , 65(8) : 1412 -1419 . DOI: 10.16511/j.cnki.qhdxxb.2024.27.049

波浪能由于具备清洁、稳定和可再生的特性,成为一种有前景的传统碳基燃料替代品,受到了极大关注[1-2]。波浪能在中国沿岸及近海储量丰富,但波浪能量密度低,在空间分布上还表现出明显差异,因此波浪能发电依然存在效率低,经济性不高等问题。如果能有效地利用波浪能,其有望成为十分有利的清洁能源之一。
波浪能发电过程通常需要三级转换:首先通过波浪能转换装置(wave energy converter, WEC)俘获波浪中的能量,继而通过能量转换传递系统将俘获的波浪能进行转换、传递等,最后通过电力转换设备将能量以电能形式输出。
为了提高波浪能发电效率,大多数研究人员优化改变WEC的结构形式或空间布局方式,抑或是优化能量转换系统参数[3-4]。这些方法虽然提高了波浪能发电效率,但提升程度依然很有限。而波浪能发电的一级过程,即WEC俘获入射波浪能量的过程未受到广泛关注,通过特殊地形或波能汇聚装置将波浪能量级放大并聚集在特定区域,再通过WEC俘获可以显著提高波浪能发电效率。
在通过特殊地形汇聚波能的研究中,Zhang等[5]基于Bragg共振原理设计了带有“V”型起伏地形的淹没式防波堤, 使波浪能量集中在指定区域。Hao等[6]通过抛物线反射镜和Bragg共振原理,提出了一种具有Bragg底的抛物线型空间布局以放大波高。
在波能汇聚装置的设计应用中,Ning和Zhang[7]基于“天眼”的抛物面结构对电磁波的汇聚原理,提出了一种新型的抛物线型防波堤,通过入射波和反射波的相互作用放大波浪能的量级并汇集到抛物线型防波堤的理论焦点位置; 同时还预测了波浪能量的汇集位置并不总是出现在抛物线的理论焦点位置。Mayon等[8]研究发现将振荡水柱(oscillating water column, OWC)与抛物线型波能汇聚装置结合后,OWC的水动力效率是放置在开敞水域相同位置时的6.5倍。此外,Mayon等[9-10]还通过物理模型实验和数值模拟,研究了抛物线型波能汇聚装置与OWC集成后,OWC布放在不同位置处的发电效率,并为OWC的空间阵列布置方式提供建议。
本文在上述工作的基础上,从源头提高WEC俘获的波浪能量,通过物理模型实验和数值模拟对抛物线型波能汇聚装置的聚能特性进行研究,分析不同波浪周期条件下抛物线型波能汇聚装置焦距变化对波能聚焦效果的影响,为该装置与WEC的集成方式提供建议和参考。

1 数值计算模型与物理模型实验

1.1 数值模型

本文采用改进色散特性的Boussinesq方程[11]模拟计算域的波浪场变化,守恒形式的Boussinesq方程可以表示为
$\begin{equation*}\frac{\partial \boldsymbol{q}}{\partial t}+\frac{\partial \boldsymbol{f}}{\partial x}+\frac{\partial \boldsymbol{g}}{\partial y}=\boldsymbol{s} . \end{equation*}$
其中:t为时间,xy为Descartes坐标,q为守恒变量的向量,fg分别为xy方向的通量向量,s为源项。在忽略黏性通量和水底层摩擦阻力的情况下,式(1)中的向量表示为
$\left\{\begin{array}{l}\boldsymbol{q}=\left[\begin{array}{l}\eta^{\prime} \\\boldsymbol{P} \\\boldsymbol{Q}\end{array}\right]=\left[\begin{array}{c}\eta^{\prime} \\\boldsymbol{u} h_{\mathrm{s}} \\\boldsymbol{v} h_{\mathrm{s}}\end{array}\right], \\\boldsymbol{f}=\left[\begin{array}{c}\boldsymbol{u} h_{\mathrm{s}} \\\boldsymbol{u}^{2} h_{\mathrm{s}}+g\left(\eta^{\prime 2}+2 \eta^{\prime} h\right) / 2 \\\boldsymbol{u} \boldsymbol{v} h_{\mathrm{s}}\end{array}\right], \\\boldsymbol{g}=\left[\begin{array}{c}\boldsymbol{v} h_{\mathrm{s}} \\\boldsymbol{u} \boldsymbol{v} h_{\mathrm{s}} \\\boldsymbol{v}^{2} h_{\mathrm{s}}+g\left(\eta^{\prime 2}+2 \eta^{\prime} h\right) / 2\end{array}\right] ,\\\boldsymbol{s}=\left[\begin{array}{c}0 \\g \eta^{\prime} h_{x}+\boldsymbol{\varPsi}_{x} \\g \eta^{\prime} h_{y}+\boldsymbol{\varPsi}_{y}\end{array}\right].\end{array}\right.$
其中:PQ分别为xy方向上的水深积分速度分量; η′为自由水面高度; h为静水深度; hs为总水深,hs=η′+h; uv分别为xy方向上的水深平均速度分量; ψxψy分别为xy方向上的Boussinesq色散项,其定义为
$\begin{gather*}\boldsymbol{\varPsi}_{x}=\left(B+\frac{1}{3}\right) h^{2}\left(\boldsymbol{P}_{x x t}+\boldsymbol{Q}_{x y t}\right)+B g h^{3}\left(\eta_{x x x}^{\prime}+\eta_{x y y}^{\prime}\right)+ \\h h_{x}\left(\frac{1}{3} \boldsymbol{P}_{x t}+\frac{1}{6} \boldsymbol{Q}_{y t}+2 B g h \eta_{x x}^{\prime}+B g h \eta_{y y}^{\prime}\right)+ \\h h_{y}\left(\frac{1}{6} \boldsymbol{Q}_{x t}+B g h \eta_{x y}^{\prime}\right) .\end{gather*}$
$\begin{gather*}\boldsymbol{\varPsi}_{y}=\left(B+\frac{1}{3}\right) h^{2}\left(\boldsymbol{Q}_{y y t}+\boldsymbol{P}_{x y t}\right)+B g h^{3}\left(\eta_{y y y}^{\prime}+\eta_{x x y}^{\prime}\right)+ \\h h_{y}\left(\frac{1}{3} \boldsymbol{Q}_{y t}+\frac{1}{6} \boldsymbol{P}_{x t}+2 B g h \eta_{y y}^{\prime}+B g h \eta_{x x}^{\prime}\right)+ \\h h_{x}\left(\frac{1}{6} \boldsymbol{P}_{y t}+B g h \eta_{x y}^{\prime}\right) .\end{gather*}$
其中:多字母下标xyt表示分别对xyt求偏导,其余多字母下标依此类推; g为重力加速度; B为色散系数,本文参考Madsen等[11]的研究结果,取B=1/15。
本文参考Ning等[12]的数值计算方法,采用切割体网格单元技术求解具有复杂结构边界的Boussinesq方程, 继而通过二阶显式MUSCL-Hancock Goduov型有限体积法求解Boussinesq方程(见式(2)),并采用HLLC近似Riemann求解器求解界面通量。

1.2 物理模型实验

物理模型实验于大连理工大学海岸和近海工程国家重点实验室的长短周期复合造波水池进行,水池长度为40 m,宽度为24 m,深度为1.2 m。沿水池长度方向,一侧安装造波系统,一侧设置消波区。水池两侧安装消波网以避免实验中产生边壁效应。如图 1所示,实验中的h设置为0.6 m,入射波高H设置为0.05 m; 抛物线型波能汇聚装置由11块宽度为2 m、高度为1 m、厚度为4 mm的钢板拼接组成,并通过三角形支架与水池底部锚固连接; 定义装置弦长中点与造波水池中线的交点O为坐标原点,装置中心轴线与造波水池中线重合,顶点距离造波板29.7 m,装置弦长l=18 m,焦距Lf=4.22 m; 实验中x轴正方向与波浪传播方向一致,y轴与波峰平行; 抛物线型波能汇聚装置的外形可通过式(5)来描述。
$\begin{equation*}y^{2}=-4 L_{\mathrm{f}} x+\left(\frac{l}{2}\right)^{2}. \end{equation*}$
图 1 抛物线型波能汇聚装置
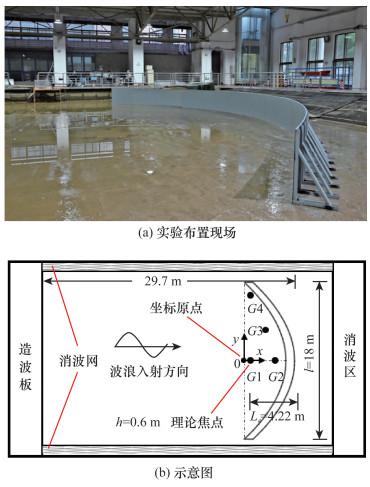
抛物线型波能汇聚装置的理论焦点位置X0可表示为
$\begin{equation*}X_{0}=\left(\frac{l}{2}\right)^{2} /\left(4 L_{\mathrm{f}}\right)-L_{\mathrm{f}} . \end{equation*}$
实验中还布置了4根采样频率为100 Hz的浪高仪G1—G4,其位置坐标分别为(0.58 m, 0)、(3.39 m, 0)、(2.48 m, 3.28 m)、(0.58 m, 5.34 m),其中浪高仪G1布放在理论焦点位置。基于Mayon等[6]的结论,为避免实验波高结果超过浪高仪量程,选择浪高仪量程为600 mm,浪高仪的量程中点位置与静水面重合。

2 分析与讨论

2.1 数值模型验证

为验证数值模型的准确性,采用实验结果进行验证。由于抛物线型波能汇聚装置的结构对称性,于是在数值模拟中只设置一半的水池宽度,计算条件与实验相同(h=0.6 m,H=0.05 m),并在计算的入口和出口边界设置了2个长度为1.5倍波长的消波区,入口消波区只吸收结构反射波,出口消波区吸收通过结构传播的波。
首先进行网格无关性和时间步长收敛性分析。数值模拟中网格单元的生成示意图如图 2所示,结构单元网格覆盖在流体区域,流场中的结构边界由一系列逆时针闭合的黑色散点表示。当相邻的黑色散点处于不同的网格中时,散点之间存在网格边界,通过线性插值可以确定各网格边界与结构物边界交点的坐标,即图中的白色散点。识别所有交点后,依次连接所有交点,流体单元网格被切割,因此切割后的网格单元被划分为流体单元、切割单元和结构单元。
图 2 网格单元生成示意图
本文采用3种不同网格密度和时间步长来评估网格密度与时间步长对数值计算结果的影响,即每个波长L包含30、50、70个网格,时间步长取波浪周期T的1/800、1/1 000、1/1 200。如图 3所示,当Lf/L=1.99时,G1和G4处的无量纲波面高度η表示为
$\begin{equation*}\eta=2 \eta^{\prime} / H . \end{equation*}$
图 3 G1和G4处无量纲波面高度变化(Lf/L=1.99)
图 3a3b的网格无关性、图 3c3d的时间步长收敛性结果可得,使用中密网格或高密网格、时间步长选择T/1 000或T/1 200时,计算结果相差小于5%。因此选择中密网格、时间步长T/1 000进行数值模拟。
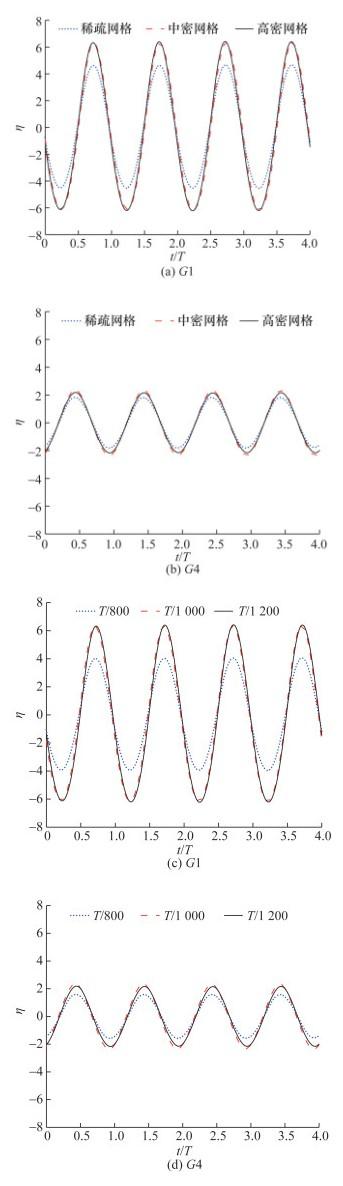
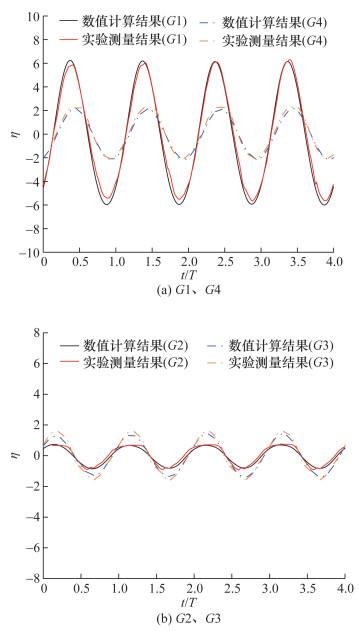
Lf/L=1.99时,G1—G4处η的数值计算结果与实验测量结果随t/T的变化趋势如图 4所示。由图可知,数值计算结果与实验测量结果具有良好的一致性。
图 4 无量纲波面高度变化的数值计算与实验测量结果对比(Lf/L=1.99)
不同T下无量纲波面幅值A的数值计算结果与实验测量结果对比如图 5所示。
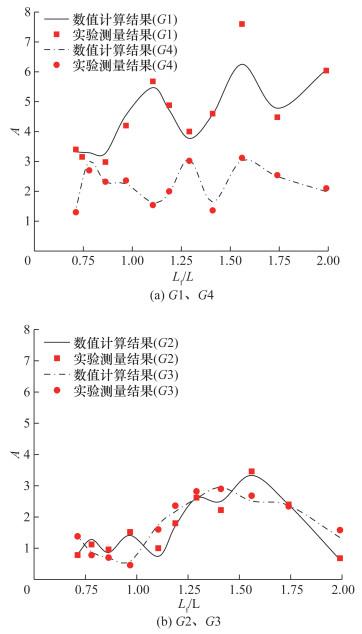
$\begin{equation*}A=2 A^{\prime} / H . \end{equation*}$
图 5 G1—G4处A的数值计算与实验测量结果对比
其中A′为波面幅值。
图 5a可知,当Lf/L=1.56时,实验测得理论焦点G1位置的A为7.6,而数值计算结果为6.25。由于实验中的浪高仪量程中点位置与静水面重合,测得波幅超过浪高仪水面上的量程,但在波谷处浪高仪还有部分量程未使用,因此测得A较大,从而产生误差。此外,本文的数值模型无法准确模拟强非线性大波幅的工况,这也导致了实验结果与数值结果产生差异。但在其他条件下,图 4图 5的结果表明数值计算结果与实验测量结果吻合较好,验证了本文数值计算模型中波浪与抛物线型波能汇聚装置相互作用的准确性。

2.2 波浪周期与焦距变化对波能聚焦位置的影响

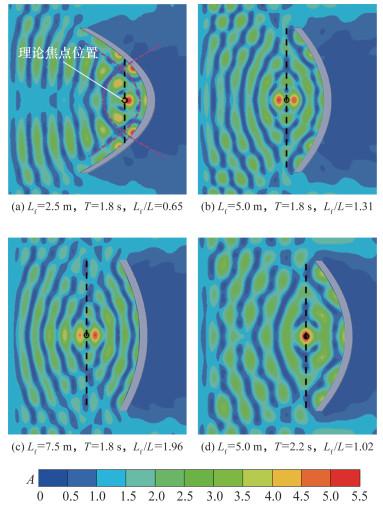
入射波作用到抛物线型波能汇聚装置后产生反射波,基于入射波与反射波的叠加作用,抛物线型波能汇聚装置能够将波浪能量聚焦到特定位置。由于L的变化,波能聚焦位置并不总是出现在抛物线型波能汇聚装置的理论焦点处。
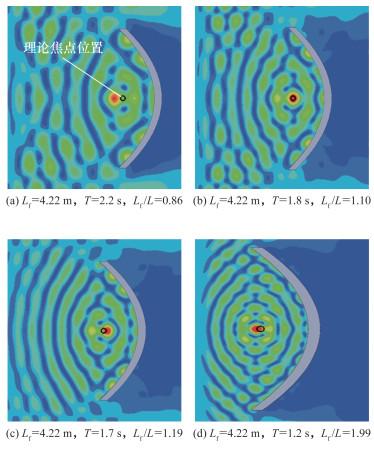
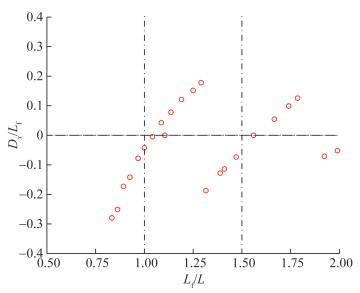
Lf=4.22 m时,不同L下,抛物线型波能汇聚装置前的波幅分布情况如图 6所示,黑色圆圈代表理论焦点位置,定义波能实际聚焦位置为最靠近理论焦点的波幅峰值位置。由图 6a可知,Lf/L=0.86时,波能实际聚焦位置出现在理论焦点的左侧。由图 6b6c可知,随着L的减小,波能实际聚焦位置逐渐向靠近装置顶点的方向移动。由图 6d可知,随着L的进一步减小,波能实际聚焦位置又向远离装置顶点的方向移动,出现在理论焦点左侧,围绕理论焦点位置进行下一次的循环往复周期性移动。
图 6 波能聚焦位置与理论焦点位置对比
波能实际聚焦位置与理论焦点位置在x方向上的无量纲距离Dx/LfLf/L的变化趋势如图 7所示,其中Dx为波能实际聚焦位置与理论焦点位置在x方向上的偏差。随着L的减小,波能实际聚焦位置从理论焦点的左侧移动至右侧后又返回到理论焦点的左侧,且当Lf/L=1.10或1.56时,波能实际聚焦位置移动至理论焦点处。因此,在Lf一定的情况下,当Lf/L≈0.5n(n为整数)时,波能实际聚焦位置与理论焦点重合。
图 7 波能聚焦位置与理论焦点位置在x方向上的无量纲距离(Lf =4.22 m时)
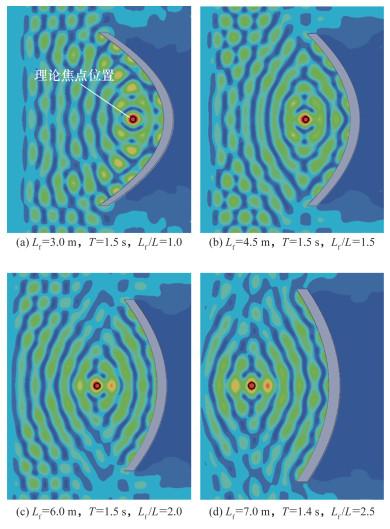
为探究其他焦距条件下该规律是否依然适用,模拟Lf/L=1.00、1.50、2.00、2.50时的波能聚焦位置并进行分析。如图 8所示,在不同LfT条件下,当Lf/L≈0.5n(n为整数)时,波能聚焦位置与理论焦点位置具有良好的重合性。
图 8 波能聚焦位置与理论焦点位置对比(Lf/L≈0.5n(n为整数))

2.3 焦距变化对波能聚焦效果的影响

抛物线型波能汇聚装置的波能聚焦效果主要以放大波面高度的形式来体现,为探究不同T条件下,Lf对波能聚焦效果的影响,本文取Lf=2.5~7.5 m,T=1.2~2.6 s进行计算分析。通过A表征波面高度的放大效果。不同T条件下,Lf变化对理论焦点位置波能聚焦效果的影响如图 9所示。
图 9 理论焦点位置无量纲波面幅值变化
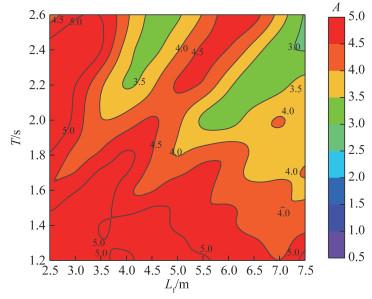
由图可知,在相同的T下,随着Lf的减小,抛物线型波能汇聚装置的开口度变小,入、反射波浪大多在装置弦长范围内汇聚,因此波能聚焦效果逐渐增强,A最大可达到5以上; 当Lf增大时,虽然效果有所减弱,但A依然保持在3以上,说明该装置具有良好的波能聚焦效果。当Lf一定时,随着T的增大,L增加,入、反射波浪在装置的l范围内的汇聚波数减少,因此理论焦点位置的A呈现减小趋势。

2.4 焦距变化对波能聚焦区域的影响

抛物线型波能汇聚装置不仅能够在理论焦点附近将入、反射波汇聚以达到波能聚焦的效果,在其他区域同样可以实现入、反射波的汇聚。由于装置的外形为抛物线型,Lf=2.5 m时的抛物线曲率线段在 图 10a中用紫色线段表示。由图可以看出,曲率线段上的波能聚焦效果保持一致,且聚能区域的分布形状与抛物线曲率线段相同,并以理论焦点为中心,沿装置l方向对称分布。
图 10 波能聚集区域分布
为探究在其他LfT条件下聚能区域的分布情况,取Lf=5 m,T=1.8或2.2 s,如图 10b10d所示。通过对比发现,聚能区域对称分布。当T=1.8 s,Lf=5和7.5 m时,由图 10b10c可知,聚能区域依然对称分布。因此,LfT的变化不会改变波能聚焦区域的对称性。但随着Lf的减小,波浪入射方向一侧的波能聚焦效果逐渐减弱,导致该侧的聚能区域逐渐模糊。

3 结论

本文基于Boussinesq方程建立了抛物线型波能汇聚装置的水动力数值分析模型,并进行了物理模型实验。通过对比实验与数值计算结果,验证了数值模型的准确性并得到以下结论:
随着焦距和波浪周期的改变,波能聚焦位置围绕理论焦点循环往复周期性移动,且当焦距与半波长的比近似为整数倍时,波能聚焦位置与理论焦点重合,波能聚焦区域依然以理论焦点为中心沿弦长方向对称分布。
随着波浪周期减小,波长减小,入、反射波浪在装置弦长范围内汇聚效果增强,波能聚焦效果愈发优异。同时,理论焦点位置的波面幅值也因焦距的减小呈现增大趋势,从而提升波能聚焦效果。
1
WANG S J , YUAN P , LI D , et al. An overview of ocean renewable energy in China[J]. Renewable and Sustainable Energy Reviews, 2011, 15 (1): 91- 111.

2
ÇELIK A . An experimental investigation into the effects of front wall geometry on OWC performance for various levels of applied power take off dampings[J]. Ocean Engineering, 2022, 248, 110761.

3
GADELHO J, SOARES C G, BARAJAS G, et al. CFD analysis of the PTO damping on the performance of an onshore dual chamber OWC[M]//SOARES C G, SANTOS T A. Trends in Maritime Technology and Engineering. London: CRC Press, 2022: 381-389.

4
TOKIḈ G G , YUE D K P . Axisymmetric reflectors in wave energy converter arrays: Harnessing scattering to increase energy extraction[J]. Physics of Fluids, 2023, 35 (6): 067120.

5
ZHANG H M , TAO A F , TU J H , et al. The focusing waves induced by Bragg resonance with V-shaped undulating bottom[J]. Journal of Marine Science and Engineering, 2021, 9 (7): 708.

6
HAO J , LI J X , LIU S X , et al. Wave amplification caused by Bragg resonance on parabolic-type topography[J]. Ocean Engineering, 2022, 244, 110442.

7
ZHANG C W , NING D Z . Hydrodynamic study of a novel breakwater with parabolic openings for wave energy harvest[J]. Ocean Engineering, 2019, 182, 540- 551.

8
MAYON R , NING D , ZHANG C , et al. Wave energy capture by an omnidirectional point sink oscillating water column system[J]. Applied Energy, 2021, 304, 117795.

9
MAYON R , NING D Z , SUN Y W , et al. Experimental investigation on a novel and hyper-efficient oscillating water column wave energy converter coupled with a parabolic breakwater[J]. Coastal Engineering, 2023, 185, 104360.

10
MAYON R , NING D Z , XU J , et al. Oscillating water column wave energy converter arrays coupled with a parabolic-wall energy concentrator in regular and irregular wave conditions[J]. Coastal Engineering, 2024, 192, 104559.

11
MADSEN P A , MURRAY R , SØRENSEN O R . A new form of the Boussinesq equations with improved linear dispersion characteristics[J]. Coastal Engineering, 1991, 15 (4): 371- 388.

12
NING D Z , XU J , CHEN L F , et al. Boussinesq modelling of near-trapping in a four-cylinder array[J]. Ocean Engineering, 2022, 248, 110767.

Outlines

/